Description
Our brains are designed as picture processors, to take what we see (the visual information delivered by our eyes) and perform processes such as recognition, identification, and comparison. Our brains do that quite well. The challenge comes when we start to read. It seems that when reading text, our brains are still functioning as picture processors, seeing the words on the page or screen as little pictures that must be decoded–recognized, identified, and compared. On top of that, when the little word picture describes an actual picture (“He was standing on a tree branch trying to reach the figs”) there must be a translation from word picture to a stored image relevant to the description.
Okay, so what? The bottom line is that actual pictures are easier to process than text, so when you want to learn something more easily, use pictures: drawings, graphs, symbols, sketches, even photographs. You can use something as simple as a stairway to represent steps in a process, or you can include many symbols to represent the process of visual thinking.
Method
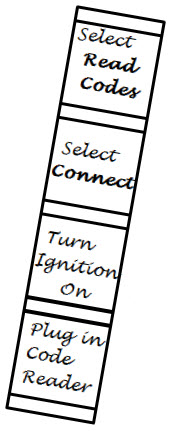
A simple but effective way to start is to use diagrams that represent relationships among ideas. For steps and sequences, you can draw stair steps, a ladder, a set of organization chart boxes with one on top of another, stacked bricks in a block wall, or any other useful metaphor you choose.
Here is an example of a ladder, with each rung representing a step in the process of using an Onboard Diagnostics, version 2 (OBD-II) engine code reader to determine which codes the car has issued and what they mean. Later, the ladder can be extended to show the steps for resetting the codes. Note how the visual sequence (in this case, from bottom up) helps you to get a sense of context and progress as you read the steps. Then, when it comes time to perform the task, you can simply “climb the ladder.”
The use of a graphical representation helps you to remember not only the content of the steps, but their relationship to each other (the correct sequence) and a sense of how far along the process a given step is.
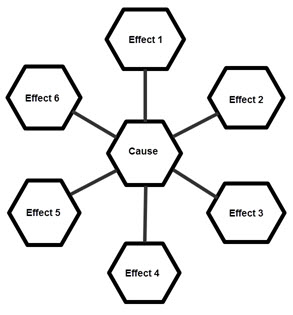
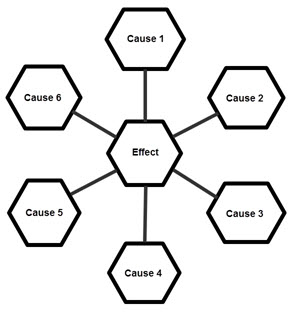
Another example would be to use a spoke diagram to show the connection between cause and effect. For a situation where you have several causes and one effect, such as the causes of the CIvil War, the Effect goes in the middle of the diagram and the Causes go around the wheel. You can draw as many spokes and wheel nodes as you need.
Conversely, if you have a situation where there are many effects from one cause, such as the effects of a flu epidemic, the Cause goes in the hub node and the Effects go in the wheel nodes.
Once again, the power lies in the visual, pictorial representation of the ideas, so that you automatically remember that there are three, four, or six causes (or effects) connected to the concept you are studying.
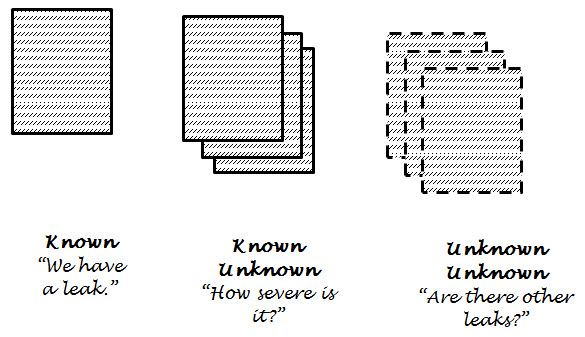
![]()
Several web sites offer free comic-strip creating capability, either by using their software on the site or by offering a free download. Why not create some study materials in the form of a comic strip? It’s true it will require some time to create the materials, but remember that during the process of creation you are also studying and learning. So, even if you never read your comics after you create them, you will have learned and will remember much more than you think.